
Knowledge is power.
And as a sales leader, you already know this. Your sales reps have a deep knowledge of how prospects can leverage the product, and they can craft customized plans about the best ways to do so. When it comes down to it, that’s what prospects actually need in sales reps.
Knowledge of your product is undeniably valuable, but it's not enough for your team to be successful. You need to understand the factors affecting your team’s performance as well. Those are what allow you to tweak yoursales processand fill gaps in knowledge as needed.
To get there, you'll need key tools known as sales analysis reports.

What is a sales analysis?
The term 'sales analysis' generally refers to the analysis of specific trends or components impacting a company's sales operations. Different analyses provide unique insight into the strengths and weaknesses of a company's sales team, sales management, individual sales reps, or overall sales strategy.
The first step to gaining a deep understanding of performance is having the right data. Yet, it's common for salespeople to ignore that fact and not usededicated technologyto track lead and customer data.
Without even basic information on contacts, sales leaders can’t hope to analyze their team’s performance or identify areas for improvement. There are some essential reports every sales leader needs to keep track of and we've listed some of the most important ones below.
Sales Analysis Reports
- Pipeline
- Typical Conversion Rates Report
- Average Deal Size Report
- Average Sales Cycle Length Report
- Marketing Collateral Usage Report
- Won and Lost Deals Analysis Report
- Churned Customers Report
- Sales Call Report
- Lead Response Time Report
- 收入报告
1. Pipeline
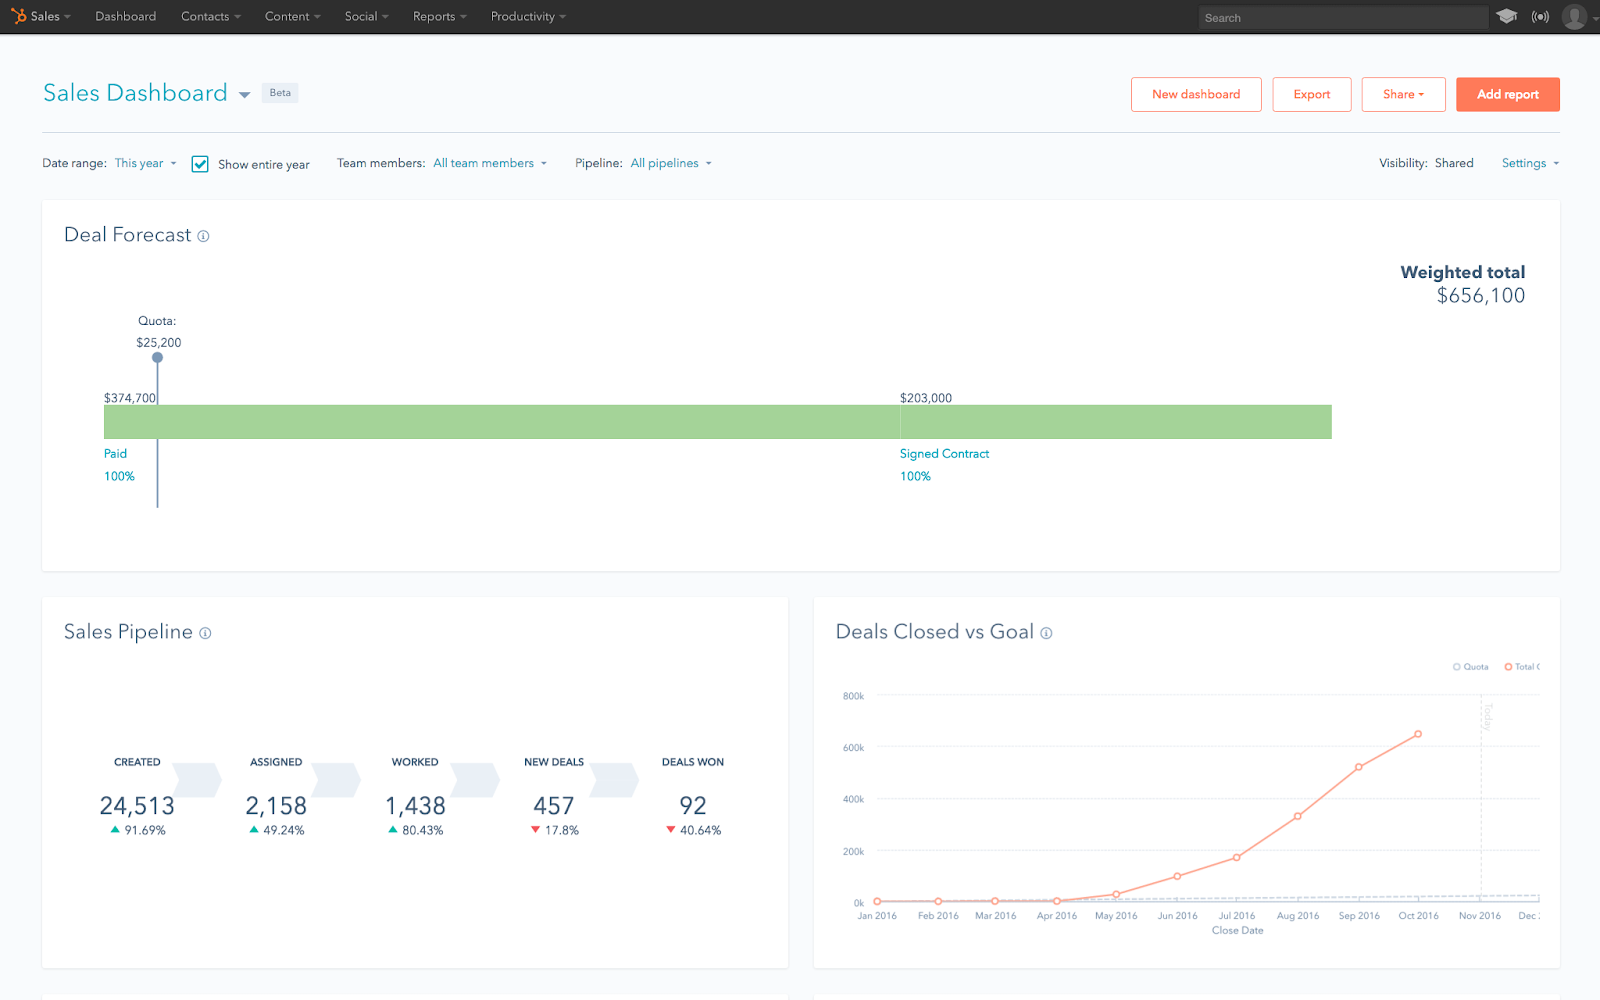
A complete and accuratepipelineis a must-have. Without one, there’s simply no way to assess the health of your business at any given time. As a sales leader, you need to know exactly which deals are a shoo-in, which you could lose altogether, and how much of an impact each deal has on your bottom line.
Of course, accurate forecasting is directly linked to thorough sales qualification. Make sure your reps are doing their due diligence to guarantee arealistic pipeline.
This is an example of what a pipeline report looks like in HubSpot Sales Hub. You’ll notice each stage of the pipeline and where opportunities are within it. You can even add forecasted deal amounts to see exactly how much each deal is worth and how close it is to closing.

2. Typical Conversion Rates Report
In the context of sales, the termconversion raterefers to your ability to convert prospects into leads and leads into customers. When considered on an operational or team-wide scale, the metric can be very telling into the efficacy of your overall sales strategy. It can also provide insight into the strengths and weaknesses of individual reps.
通过监测你的转化率,你可以销wn the points in your sales lifecycle where you're excelling or underperforming. If you're consistently converting leads to opportunities at a high conversion rate, you can bolster whatever strategies you're using at that point in the process. But if your team is having trouble converting opportunities to customers, you can start identifying areas for improvement at that stage.
It's also a solid litmus test for individual reps' strengths and weaknesses. If a rep is underperforming altogether, you can look into their conversion rate to see where they need help.

3. Average Deal Size Report
Your average deal size is crucial in predicting revenue and monitoring the soundness of your sales pipeline. If your revenue target is $200k for a quarter and your average deal size is $20k, then you understand you're trying to land 10 deals in that timeframe. That might seem obvious, but it's still important to keep tabs on this metric.
The average deal size report provides the basis for your reps'quotasand lets them know roughly how many deals they're expected to land. It also allows you to set expectations and milestones for your sales cycle. Ultimately, it might seem like a no-brainer, but it's still worth a reminder — always monitor your average deal size. It provides a critical structure to your sales operations.

4. Average Sales Cycle Length Report
Averagesales cyclelength is exactly what it sounds like — the average time it takes for a rep to close a sale. It's a straightforward metric that can be very indicative of individual rep performance and the overall efficacy of your sales process.
When considering the metric, you have to establish an ideal timeframe to use as a benchmark. One of those benchmarks should be how long it takes a rep to work through your sales cycle. If you're finding individual reps are struggling here — taking longer than their peers or your standards — you can take the time to look at their efforts and identify areas for coaching.
If all your reps are struggling to keep pace with your target average sales cycle length, then it's probably time to take an objective look at your operations. You might find fundamental flaws in your approach, your training, or your management style, and this insight can help you remedy them.

5. Marketing Collateral Usage Report
Hopefully, your marketing team is creating collateral that helps your reps move their prospects through the sales process. And hopefully, your sales reps are using it to good effect.
But if they aren’t, or the marketing collateral you’re getting isn’t relevant to your prospects, you need to find that out as soon as possible. You can easily track what marketing content is working in all your sales cycles and which documents have sat untouched for months. Communicate that information to your marketing team and you’ll be rewarded with more relevant and useful content.
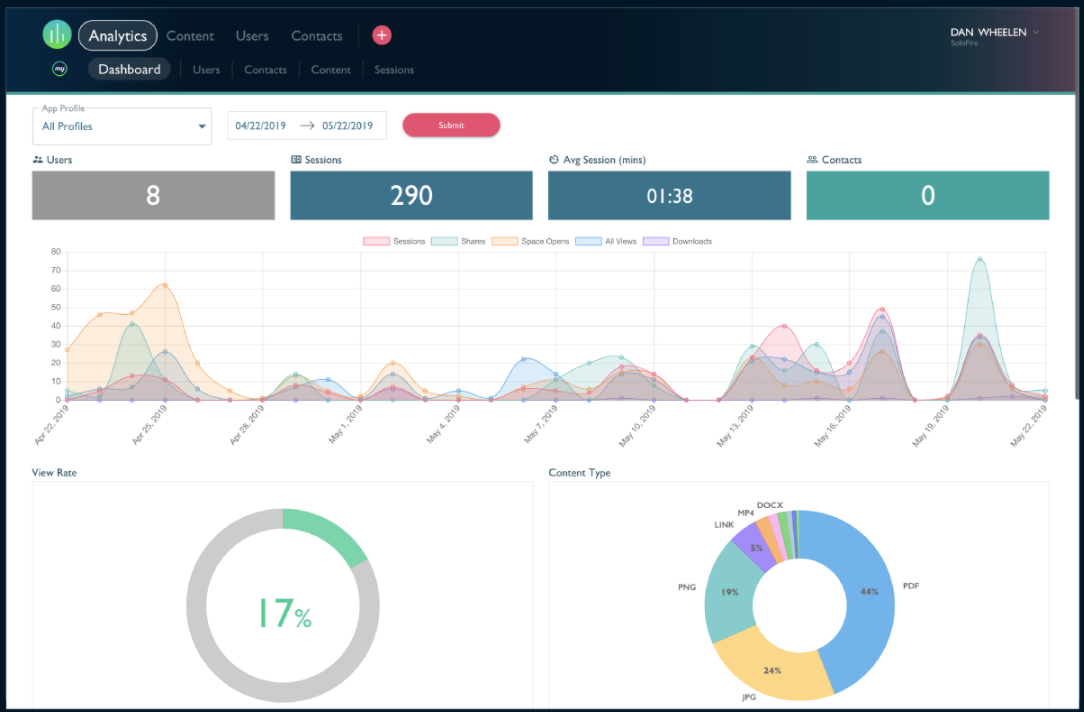
Here we can see that Solo fire tracks how many people have used a piece of collateral, how many times they’ve interacted with it and for how long.
6. Won and Lost Deals Analysis Report
Deals-in-progress aren’t the only ones you should be focusing on. To understand the state of your business, you should be tracking all the deals you win and lose. Are there specific features prospects always go crazy for, or competitors you consistently lose to? Look for commonalities between these deals and you’ll gain valuable insight into your product’s overall strengths and weaknesses.
This is also a good way to spot under- and over-performers. For example, two reps who have the same average quota attainment could both appear to be stellar, but differ wildly when it comes to actual performance.
If your data reveals that one rep spends a lot of time helping others get deals across the finish line while still maintaining high attainment, you have a great manager candidate on your hands.
On the flip side, records could reveal that a second rep has the same attainment as the first, but relies on other teammates to run demos or closing calls. There’s always a story beyond what the numbers tell you, and analyzing won and lost deals by rep will reveal it.

7. Churned Customers Report
Understanding why peoplechurnout of your customer base can be even more revealing than evaluating why deals were lost. After all, a churned customer is a clear sign that misalignment occurred somewhere during the sales process. Closely monitoring trends in churned customers empowers you to provide direct guidance on fixing bad patterns throughout the sales process.

8. Sales Call Report
One way to measure the effectiveness of your sales reps is to track the number of calls or visits they make to prospects. You can use this report to track theclose rateof your team.
Ideally, you’d want your reps closing a healthy number of deals compared to the number of prospects they meet with. If they meet with ten per day, but close none, you could use this report to understand why and offer better closing techniques. If the opposite is true, you can find what’s working and share those tactics across the wider team.
A sales call report can segment data about the prospects your reps are calling. If a certain industry is responding well to your products and services, you could even make a case to narrow down your call list and sell to aniche market.

9. Lead Response Time Report
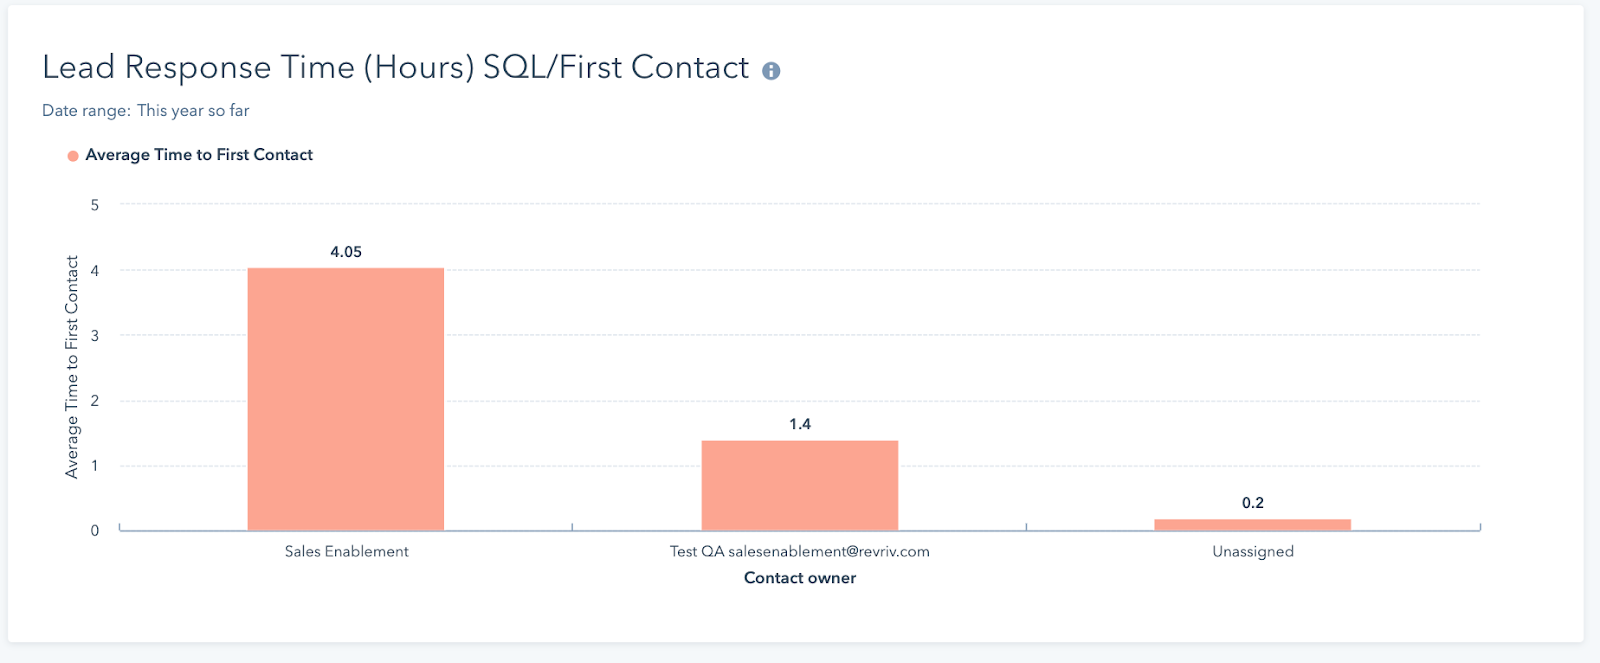
Regardless of the length of your sales cycle, lead response time should be relatively quick. Studies have shown that contacting prospects within the first five minutes of them becoming a leadincreases the likelihoodthat you’ll convert them into an opportunity.
Five minutes is short and if you’re not close to meeting that goal, the best thing to do is track your progress. You won’t move from a 48-hour lead response time to a five minute one overnight. But by making some strategic decisions andprioritizing your sales team’s workload, this goal can be attainable.
10. Revenue Report
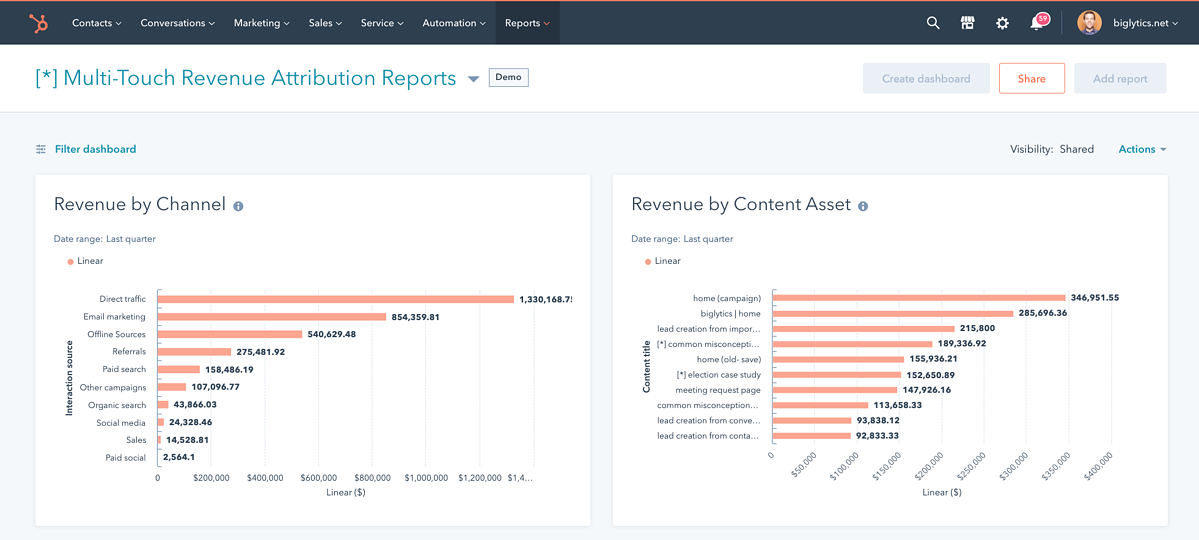
As a nice complement to the average deal size report, a revenue report can help you and your reps see how their work is impacting the bottom line. In this report, you’ll be able to see a breakdown of new business and renewals and which reps contributed to each. To get the most out of this report, you’ll want toset your sales and revenue goals, first.
Build Reports Your Sales Team Will Use
As a sales leader, you have a lot to keep track of. It helps to know what different information sources can reveal about your reps, your strategies, or your management style. All of these reports can provide critical insight into what you're doing well and what you could be doing better.
If there's anything to take away from this article, it's this — always track your customer and lead data. If you're not, you're missing out on reports that will undoubtedly help your business be the best it can be.
Editor's note: This post was originally published inMarch 2016 and has been updated for comprehensiveness.
Originally published Apr 5, 2021 2:15:00 PM, updated June 10 2021